Structure and customization
The dashboard is the first page that is displayed when you access DataWeb.
It is composed of widgets, which are content-based elements used to highlight areas, graphics or other things.
The configuration of a dashboard is personal, and you can modify the widgets and the order they appear in however you want to: every user has their own dashboard.
It is composed of widgets, which are content-based elements used to highlight areas, graphics or other things.
The configuration of a dashboard is personal, and you can modify the widgets and the order they appear in however you want to: every user has their own dashboard.
When you first access the dashboard, "Area Structure" is automatically generated with a list of widgets. These are specialist elements for the displaying of the sections in a specific area.
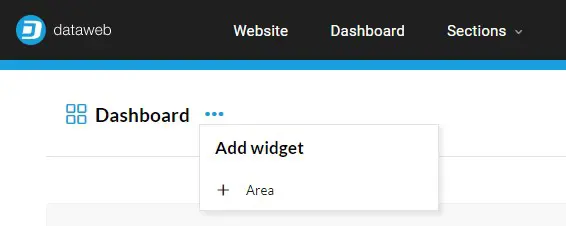
If you want to add an area to the dashboard, go to the “Dashboard” menu on the right and select “Add widget + Area”. The widget is widget is positioned under all of the others and the first area not present in the dashboard is automatically taken.
You can change the widget by selecting the icon to the right of the area name and then selecting the "Settings" action.
Having selected the area of interest, confirm your choice to see the changes applied.
Again from this menu, you can select "Delete" to remove the widget from the page.
In addition, you can move the widget by dragging it wherever you like. As you drag it, you will see a number of drop zones lighting up.
The Trends widget allows you to analyze the progress of a metric in the project.
Having agreed with the development team which metric to use, the element will be visible under “Add widget".
Having agreed with the development team which metric to use, the element will be visible under “Add widget".
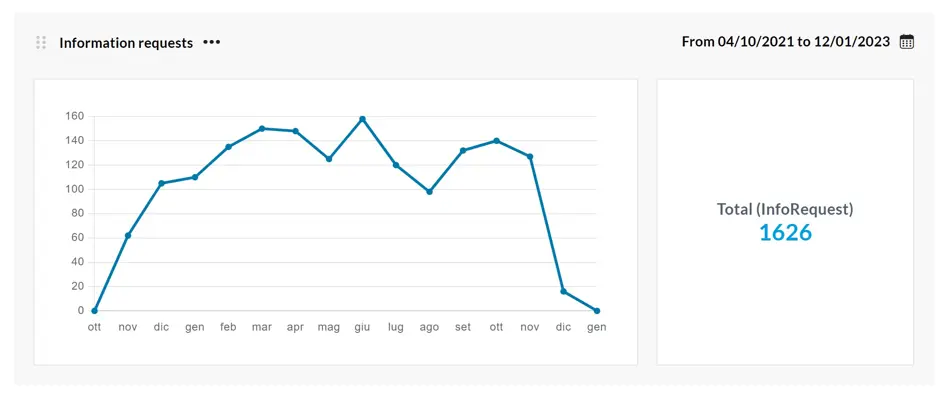
The widget allows you to set the period of analysis and to compare different periods, adding the same item multiple times.